Lies, damned lies and statistics
 It’s easy to put labels on players. But do statistics tell the full story? The answer is no, but they can be helpful.You can prove just about anything with statistics. As Benjamin Disraeli, or was it Mark Twain, once wrote: “There are three kinds of lies: lies, damned lies, and statistics.”
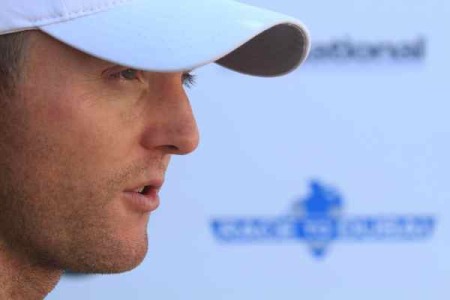
Or as Pádraig Harrington put it at Pebble Beach back in February: “You can use stats like a drunk man uses a lamp post, for support rather than illumination…
“I could turn around and tell you, I’ve won the most majors in the last five years, so I must be the best player in the world. You know, that’s my stat. I could hang onto that, couldn’t I?
“So we can all come up with a stat. Beating Tiger. All it is is a stat. It really doesn’t mean… you’re trawling the statistics to try to find something of interest, I’m sorry to say… I do my own stats when it comes to tournaments, because as we all know, we’re struggling to make meaning of the stats that are out there.
“You know, I’m sure now because of the movie there, “Moneyball,” with the different stats, we’re still trying to find out what stats matter in golf. My favourite one is how many times you hit your first putt from inside ten feet. That to me determines how well I’ve played, whereas nobody else will throw that in as an important stat.
“The percentage of holing from inside ten feet is so high, the more times you hit your first putt in there, whether you’ve chipped it in there or holed it for par or you’ve hit it in there close, there’s loads of different ways of analyzing it, but we have never really nailed down what’s the most important stat.
“When I’m writing my bio and my CV, I might remember that one and put it in there. You know, I do need my ego built up.”
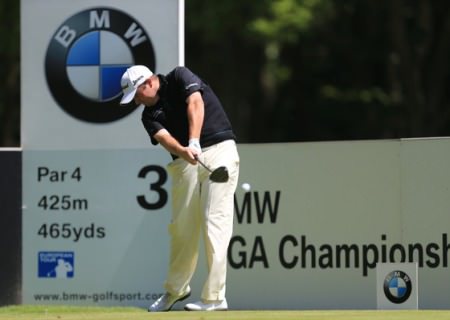
The European Tour has an annual statistics award - the Genworth Performance Award - which rates players in six categories each quarter and for the season overall. Total driving, greens in regulation, scrambling, putts per round, strokes average and money per event are taken into account and players must complete a minimum 40 rounds to qualify.
World No 1 Rory McIlroy, who won the Race to Dubai nearly two weeks ago, does not figure in the results because he played just 24 counting rounds in many instances according to the tour.
South African Louis Oosthuizen has a huge lead over Luke Donald, who is playing just his 13th event of the European Tour season in Dubai this week with Graeme McDowell the only Irish player in the top 20 at seventh with an average rank of 47.17 compared to Oosthuizen’s 11.92.
Looking at the nine statistical category on the European Tour, we’ve ranked the 11 Irish players with full cards by there average ranking for all aspects of the game from driving accuracy and distance to greens in regulation, putts per round and per green in regulation, bunker saves, scrambling, one putts and stroke average.
How the Irish players rank (average of 9 European Tour categories)
- Rory McIlroy 60.11
- Graeme McDowell 63.77
- Shane Lowry 65.11
- Padraig Harrington 69.44
- Peter Lawrie 95.77
- Damien McGrane 110.77
- Gareth Maybin 116.55
- Paul McGinley 133.77
- Michael Hoey 138.88
- Simon Thornton 144.22
- Darren Clarke 157.33
No major surprises there, I think you’ll agree, though Michael Hoey’s position is deceptive. A fourth tour win in Morocco earlier this year accounted for half his prize money and turned what could be regarded as an inconsistent season into a good one.
McIlroy ranks highly in almost every category except driving accuracy and putts per round while Shane Lowry, Gareth Maybin and Damien McGrane excel on and around the greens.
And that’s where the trouble lies for several of Ireland’s tour stars. Darren Clarke, Paul McGinley, Peter Lawrie and Simon Thornton all struggle to hole putts.
As for McDowell, while arrow staight and deadly on the greens, he’s one of the worst bunker players on both the European and the PGA Tour.
Harrington knows he’s had a poor year on the greens yet he’s still managed to contend in two majors. How many times he had his first putt from inside 10 feet is anyone’s guess.
Stroke average
- Rory McIlroy (4) 69.98 [PGA TOUR (1) 68.873]
- Graeme McDowell (12) 70.45 [PGA TOUR (32) 70.229]
- Shane Lowry (25) 70.71
- Padraig Harrington (51) 71.04 [PGA TOUR (13) 69.736]
- Peter Lawrie (60) 71.1
- Damien McGrane (92) 71.44
- Paul McGinley (127) 71.73
- Gareth Maybin (134) 71.79
- Simon Thornton (162) 72.00
- Darren Clarke (218) 72.68
- Michael Hoey (244) 73.43
Driving accuracy
- Peter Lawrie (20) 69.7%
- Graeme McDowell (30) 67.9% [PGA TOUR (5) 70.11%]
- Paul McGinley (42) 66.4%
- Darren Clarke (45) 66.2%
- Shane Lowry (48) 66.1%
- Simon Thornton (97) 62.3%
- Rory McIlroy (141) 58.8% [PGA TOUR (156) 56.61%]
- Damien McGrane (157) 58.0%
- Padraig Harrington (170) 57.4% [PGA TOUR (120) 59.86%]
- Gareth Maybin (183) 56.5%
- Michael Hoey (204) 54.0%
Driving distance
- Rory McIlroy (13) 302.0 yards [PGA TOUR (4) 298.6]
- Padraig Harrington (34) 296.4 yards [PGA TOUR (102) 281.2]
- Michael Hoey (93) 290.3 yards
- Shane Lowry (109) 288.9 yards
- Graeme McDowell (137) 284.6 yards [PGA TOUR (128) 280.0]
- Darren Clarke (162) 281.9 yards
- Paul McGinley (166) 281.5 yards
- Simon Thornton (185) 279.8 yards
- Damien McGrane (195) 277.5 yards
- Peter Lawrie (205) 276 yards
- Gareth Maybin (206) 275.3 yards
Greens in regulation
- Rory McIlroy (2) 79.5% [PGA TOUR (60) 66.36%]
- Padraig Harrington (30) 72.6% [PGA TOUR (161) 62.17%]
- Graeme McDowell (34) 72.4% [PGA TOUR (67) 66.26%]
- Peter Lawrie (43) 71.6%
- Michael Hoey (73) 70.5%
- Paul McGinley (74) 70.5%
- Darren Clarke (96) 69.2%
- Shane Lowry (107) 68.7%
- Simon Thornton (110) 68.5%
- Damien McGrane (161) 66.3%
- Gareth Maybin (171) 65.8%
Putts Per Gir
- Shane Lowry (15) 1.744
- Graeme McDowell (33) 1.758 [PGA TOUR (8) 1.739]
- Rory McIlroy (40) 1.762 [PGA TOUR (T6) 1.738]
- Gareth Maybin (77) 1.78
- Michael Hoey (112) 1.793
- Damien McGrane (118) 1.795
- Padraig Harrington (120) 1.795 [PGA TOUR (T22) 1.749]
- Peter Lawrie (132) 1.8
- Paul McGinley (181) 1.811
- Simon Thornton (195) 1.829
- Darren Clarke (209) 1.842
Putts Per Round
- Shane Lowry (23) 29.3
- Damien McGrane (51) 29.4
- Gareth Maybin (53) 29.4
- Graeme McDowell (54) 29.4 [PGA TOUR (69) 29.02]
- Padraig Harrington (118) 30 [PGA TOUR (9) 28.41]
- Rory McIlroy (129) 30.1 [PGA TOUR (T32) 28.72]
- Peter Lawrie (155) 30.3
- Simon Thornton (156) 30.3
- Michael Hoey (179) 30.5
- Paul McGinley (188) 30.6
- Darren Clarke (213) 31
Sand saves
- Rory McIlroy (5) 73.9% [PGA TOUR (22) 56.16%]
- Padraig Harrington (34) 63.2% [PGA TOUR (10) 59.41%]
- Peter Lawrie (62) 59.7%
- Gareth Maybin (69) 59.1%
- Darren Clarke (83) 56.9%
- Simon Thornton (95) 55%
- Shane Lowry (103) 54.1%
- Damien McGrane (113) 52.5%
- Paul McGinley (125) 51%
- Michael Hoey (142) 48.7%
- Graeme McDowell (196) 42.3% [PGA TOUR (189) 33.33%]
Scrambles
- Padraig Harrington (24) 59.4% [PGA TOUR (39) 59.67%]
- Graeme McDowell (31) 58.9% [PGA TOUR (177) 51.83%]
- Damien McGrane (36) 58.6%
- Gareth Maybin (66) 56.1%
- Rory McIlroy (77) 55.6% [PGA TOUR (33) 60.24%]
- Peter Lawrie (80) 55.5%
- Simon Thornton (84) 55.4%
- Shane Lowry (86) 55.1%
- Paul McGinley (113) 53.5%
- Michael Hoey (203) 45.9%
- Darren Clarke (206) 45.4%
One Putts
- Padraig Harrington (44) 5.86 [PGA TOUR (10) 7.08]
- Graeme McDowell (47) 5.84 [PGA TOUR (55) 6.98]
- Shane Lowry (70) 5.67
- Damien McGrane (74) 5.61
- Gareth Maybin (90) 5.49
- Peter Lawrie (105) 5.4
- Rory McIlroy (130) 5.27 [PGA TOUR (23) 6.61]
- Darren Clarke (184) 4.97
- Michael Hoey (186) 4.94
- Paul McGinley (188) 4.93
- Simon Thornton (214) 4.69